| Chain sequence(s) | SMTDEEREHLEHFIASNDEASAIAKDFVSRYHKAESEAEQESLLVETARKLSDLYRELL input PDB |
| Selected Chain(s) | A |
| Distance of aggregation | 10 Å |
| FoldX usage | Yes |
| pH calculations | Yes |
| Dynamic mode | No |
| Automated mutations | No |
| Downloads | Download all the data |
| Simulation log |
[INFO]       Logger:   Verbosity set to: 2 - [INFO]                                                (00:00:00)
[WARNING]    runJob:   Working directory already exists (possibly overwriting previous results -ow
                       to prevent this behavior)                                                   (00:00:00)
[INFO]       runJob:   Starting aggrescan3d job on: input.pdb with A chain(s) selected             (00:00:00)
[INFO]       runJob:   Creating pdb object from: input.pdb                                         (00:00:00)
[WARNING]    PDB-Info: The input structure is likely a peptide. Results may be inaccurate.         (00:00:01)
[INFO]       PDB-Info: The input structure is partially or entirely disordered. Average score is
                       recommended for pH analysis.                                                (00:00:01)
[INFO]       FoldX:    Starting FoldX energy minimization                                          (00:00:01)
[INFO]       Analysis: Starting Aggrescan4D on folded.pdb                                          (00:01:13)
[INFO]       agg3D:    Running pKa-ANI on
                       /STORAGE/DATA/lcbio/aggreskan/c6ec11a1288212/tmp/folded.pdb                 (00:01:13)
[INFO]       Main:     Simulation completed successfully.                                          (00:01:35)
|
The table below lists A3D score for protein residues. Residues with A3D score > 0.0000 are marked by yellow rows.
| residue index | residue name | chain | Aggrescan3D score | mutation |
|---|---|---|---|---|
| residue index | residue name | chain | Aggrescan3D score | |
| 1 | S | A | -0.1904 | |
| 2 | M | A | -0.8729 | |
| 3 | T | A | -2.4462 | |
| 4 | D | A | -4.1254 | |
| 5 | E | A | -4.6783 | |
| 6 | E | A | -4.4658 | |
| 7 | R | A | -5.0864 | |
| 8 | E | A | -5.2434 | |
| 9 | H | A | -4.2499 | |
| 10 | L | A | -3.1621 | |
| 11 | E | A | -3.8178 | |
| 12 | H | A | -2.9237 | |
| 13 | F | A | 0.0000 | |
| 14 | I | A | -1.6794 | |
| 15 | A | A | -1.4329 | |
| 16 | S | A | -1.3845 | |
| 17 | N | A | -1.7432 | |
| 18 | D | A | -2.7542 | |
| 19 | E | A | -2.9347 | |
| 20 | A | A | 0.0000 | |
| 21 | S | A | -2.0971 | |
| 22 | A | A | -1.7692 | |
| 23 | I | A | -1.4886 | |
| 24 | A | A | -1.6486 | |
| 25 | K | A | -2.3074 | |
| 26 | D | A | -2.2939 | |
| 27 | F | A | -1.3208 | |
| 28 | V | A | -0.7058 | |
| 29 | S | A | -2.0688 | |
| 30 | R | A | -3.3305 | |
| 31 | Y | A | -2.5518 | |
| 32 | H | A | -2.2948 | |
| 33 | K | A | -3.2898 | |
| 34 | A | A | -3.4063 | |
| 35 | E | A | -3.4024 | |
| 36 | S | A | -2.9345 | |
| 37 | E | A | -3.3372 | |
| 38 | A | A | -2.6277 | |
| 39 | E | A | -3.4888 | |
| 40 | Q | A | -3.1179 | |
| 41 | E | A | -2.4931 | |
| 42 | S | A | -1.4067 | |
| 43 | L | A | -1.2129 | |
| 44 | L | A | -0.0117 | |
| 45 | V | A | 0.0484 | |
| 46 | E | A | -1.3403 | |
| 47 | T | A | 0.0000 | |
| 48 | A | A | -1.0463 | |
| 49 | R | A | -2.6956 | |
| 50 | K | A | -2.9310 | |
| 51 | L | A | 0.0000 | |
| 52 | S | A | -2.5108 | |
| 53 | D | A | -3.2560 | |
| 54 | L | A | -2.0148 | |
| 55 | Y | A | -0.8727 | |
| 56 | R | A | -2.1741 | |
| 57 | E | A | -1.8687 | |
| 58 | L | A | 0.4622 | |
| 59 | L | A | 0.8927 |
Calculations for various pH values
This page contains details and comparisons for all models calculated at different pH points.
pH |
Average A3D Score |
Max A3D Score |
|||
| 4.0 | -2.3353 | 1.0585 | View | CSV | PDB |
| 4.5 | -2.5847 | 0.9464 | View | CSV | PDB |
| 5.0 | -2.907 | 0.7875 | View | CSV | PDB |
| 5.5 | -3.2454 | 0.6034 | View | CSV | PDB |
| 6.0 | -3.5562 | 0.418 | View | CSV | PDB |
| 6.5 | -3.8028 | 0.2543 | View | CSV | PDB |
| 7.0 | -3.9593 | 0.1319 | View | CSV | PDB |
| 7.5 | -4.0378 | 0.0507 | View | CSV | PDB |
| 8.0 | -4.071 | 0.0 | View | CSV | PDB |
| 8.5 | -4.0768 | 0.0 | View | CSV | PDB |
| 9.0 | -4.0558 | 0.0 | View | CSV | PDB |
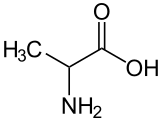 ALA alanine
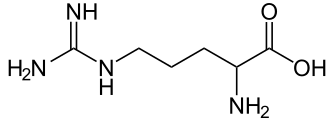 ARG arginine
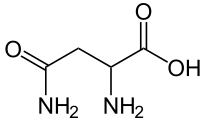 ASN asparagine
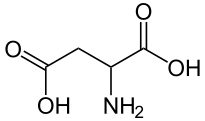 ASP aspartic acid
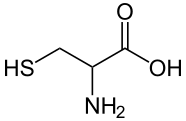 CYS cysteine
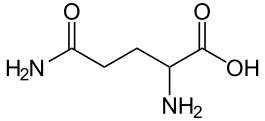 GLN glutamine
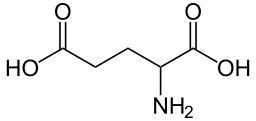 GLU glutamic acid
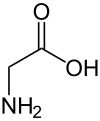 GLY glycine
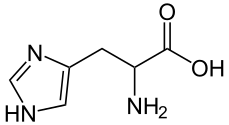 HIS histidine
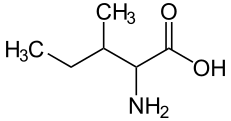 ILE isoleucine
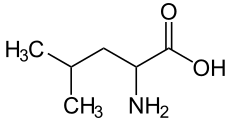 LEU leucine
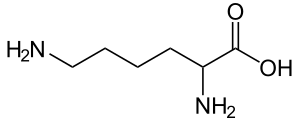 LYS lysine
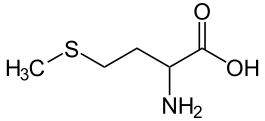 MET methionine
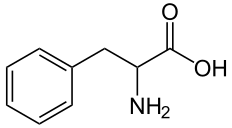 PHE phenylalanine
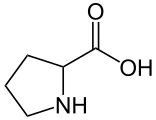 PRO proline
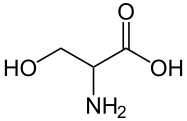 SER serine
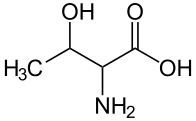 THR threonine
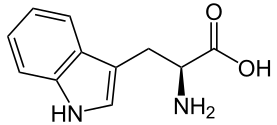 TRP tryptophan
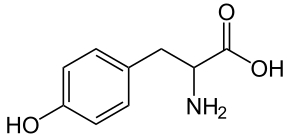 TYR tyrosine
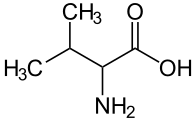 VAL valine